Full page tour
All dashboard pages: overview, pods, NodeClaims, NodePools, nodes, graph, logs, metrics, events, fleet. Screenshots are captured during the GCP integration test (scheduled phase). Run ./hack/integration-test-e2e-gcp.sh from cloudburst-autoscaler, then ./scripts/copy-screenshots-to-landing.sh from cloudburst-autoscaler-ui to populate.
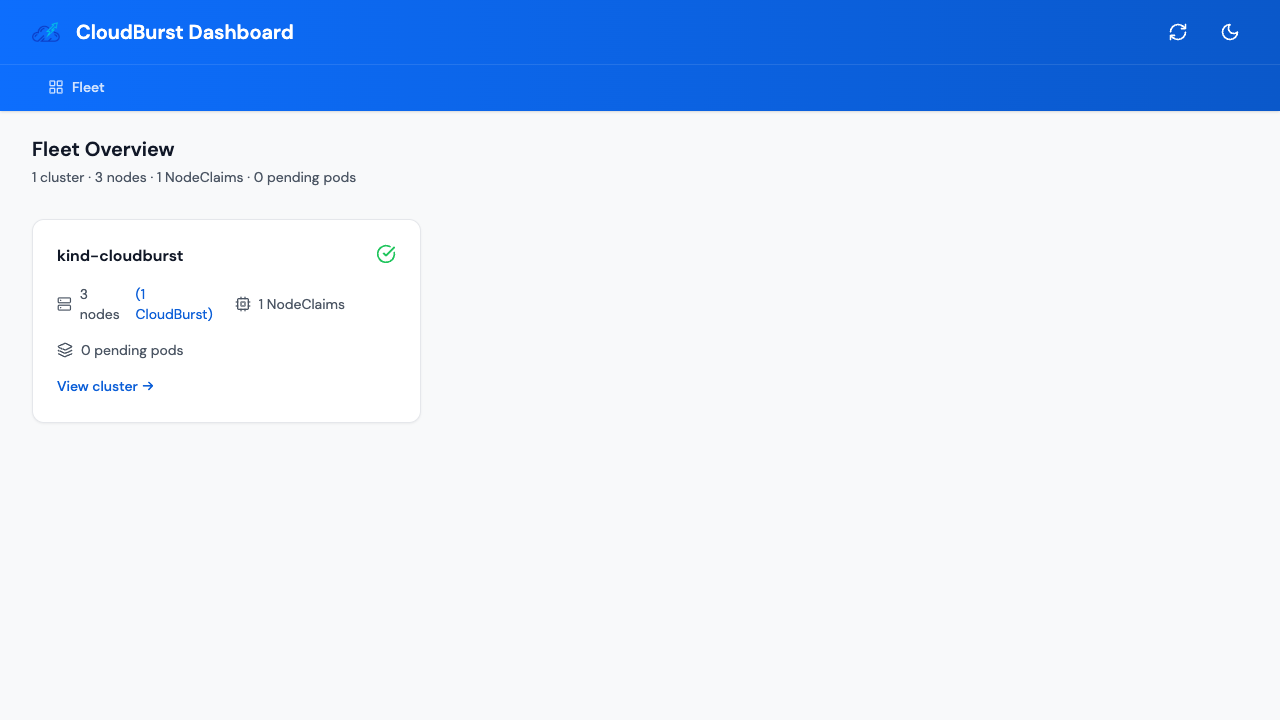
Fleet overview
Multi-cluster view when managing multiple clusters.
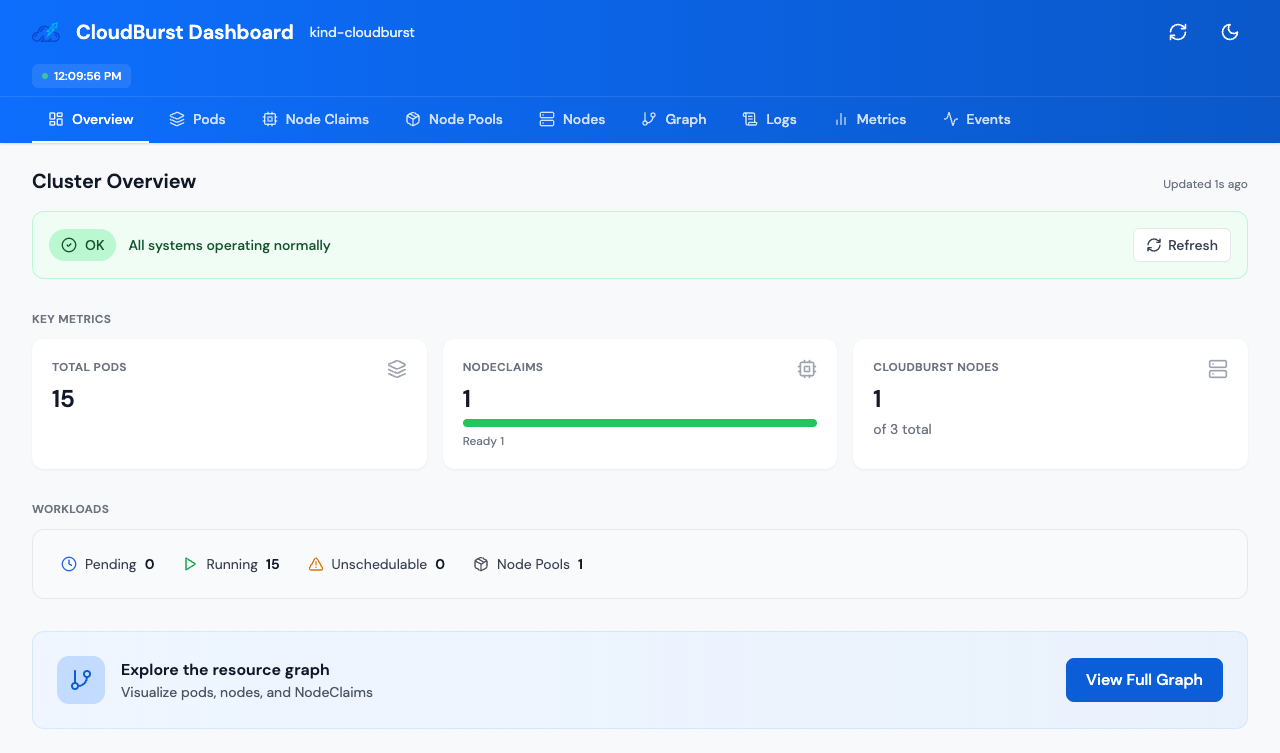
Overview
Cluster overview with workload summary: total pods, NodeClaims, NodePools, nodes, and capacity.
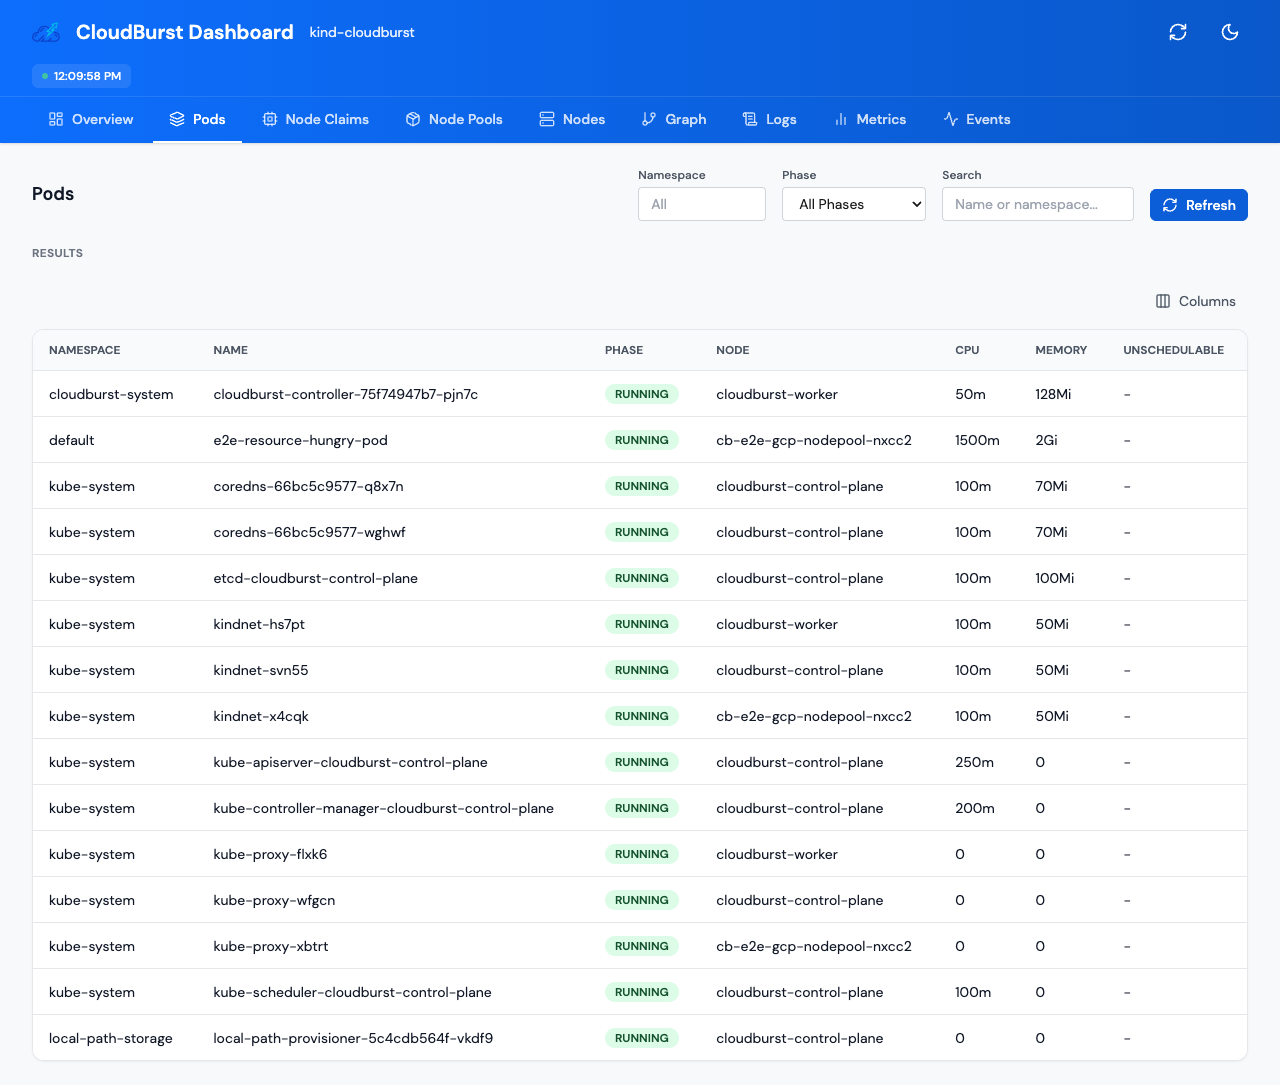
Pods
List of pods across namespaces with status, node, and resource requests.
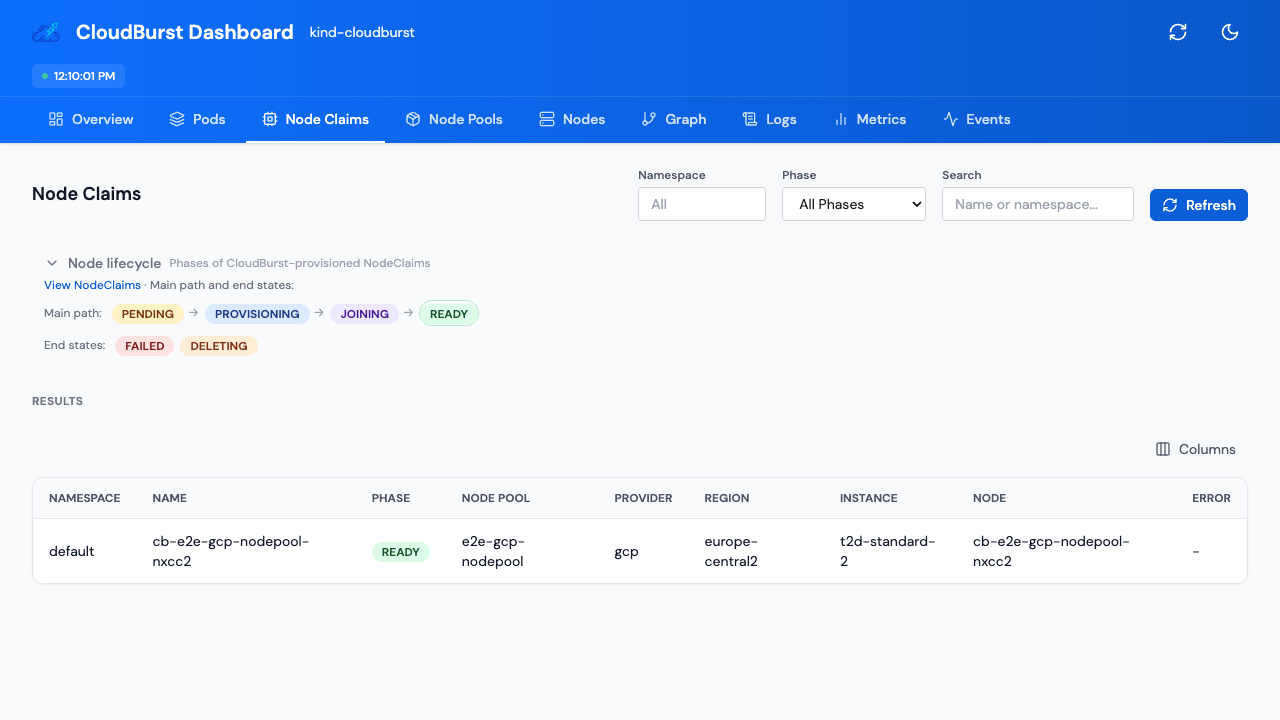
NodeClaims
NodeClaims created by the autoscaler: provider, region, instance type, phase (Provisioning, Joining, Ready).
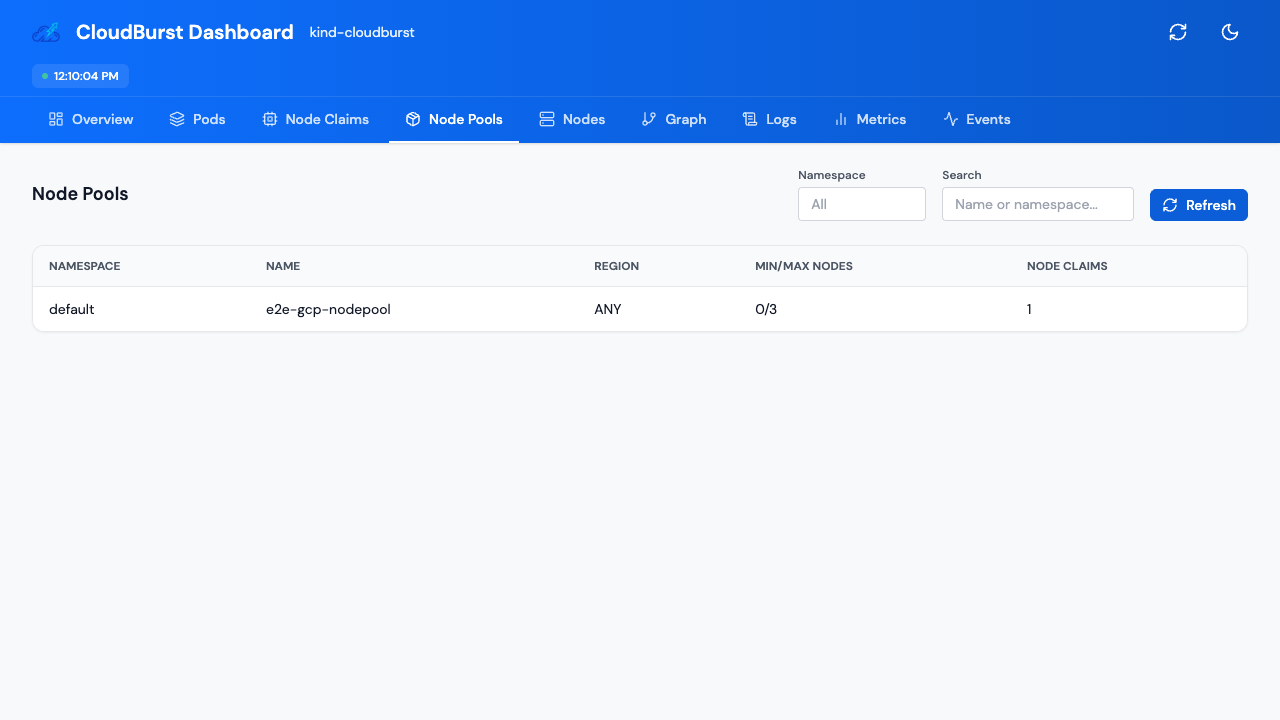
NodePools
NodePools define burst policy: min/max nodes, instance constraints, TTL after empty.
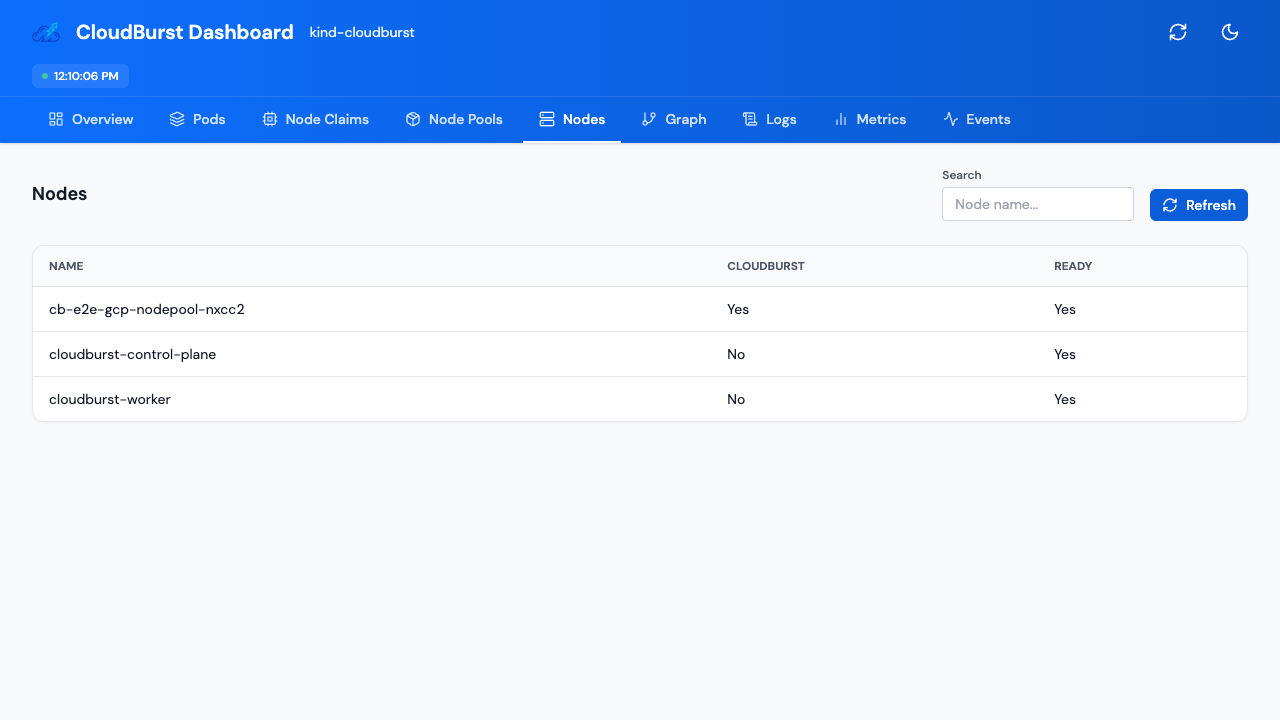
Nodes
Kubernetes nodes: status, version, provider labels, capacity.
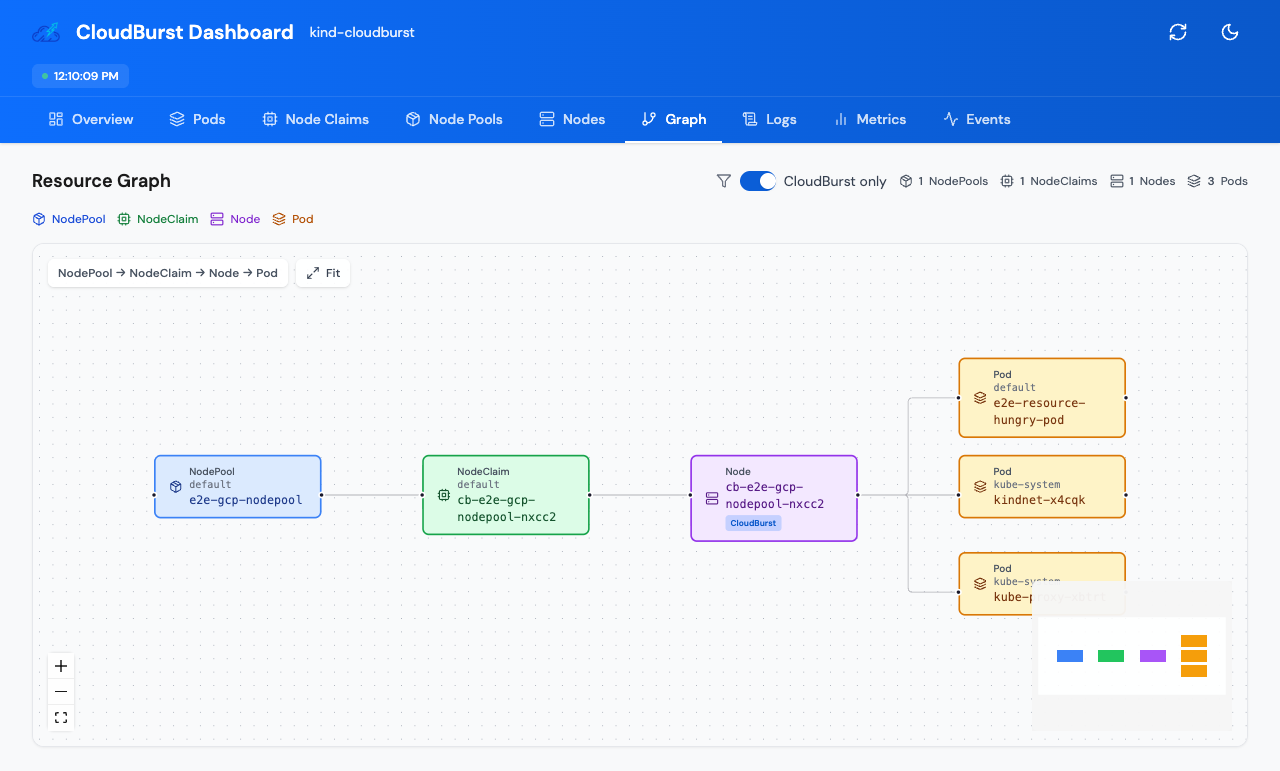
Resource Graph
Interactive graph of NodePools, NodeClaims, Nodes, and Pods and their relationships.
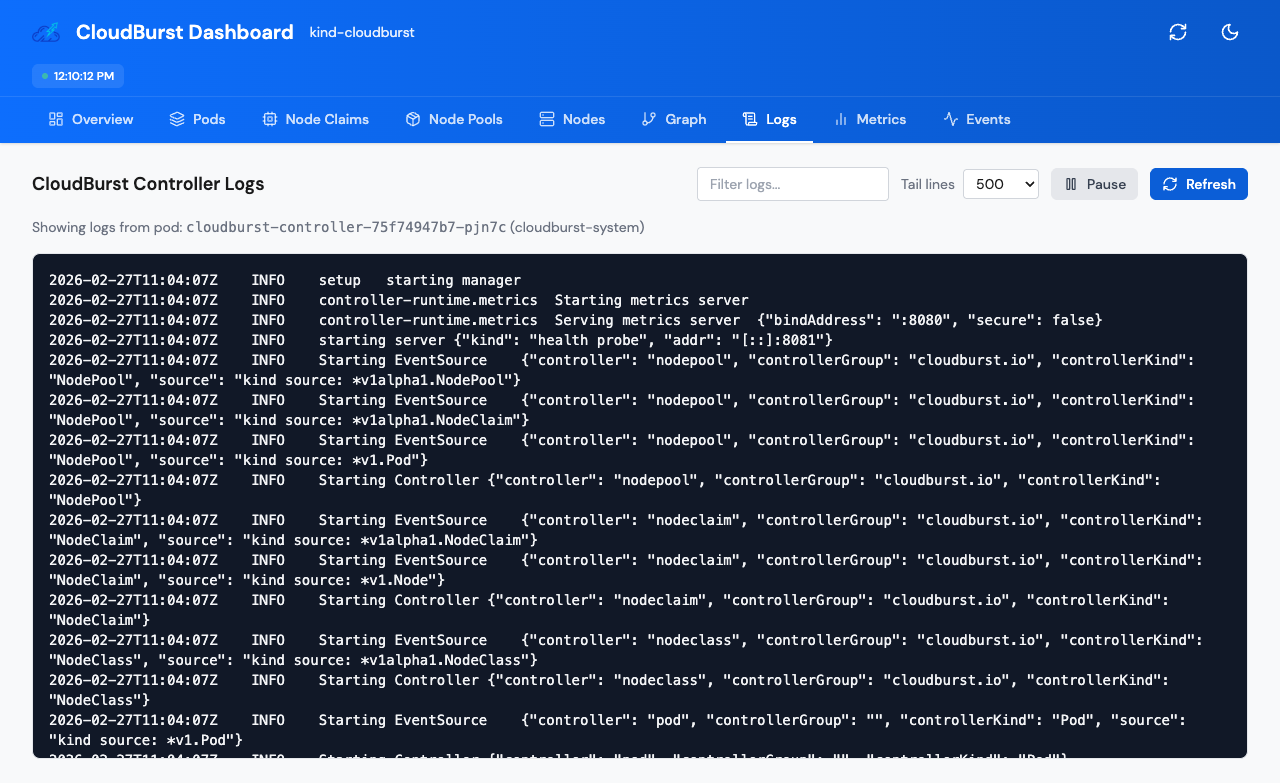
Logs
Controller logs streamed from the cluster for debugging and observability.
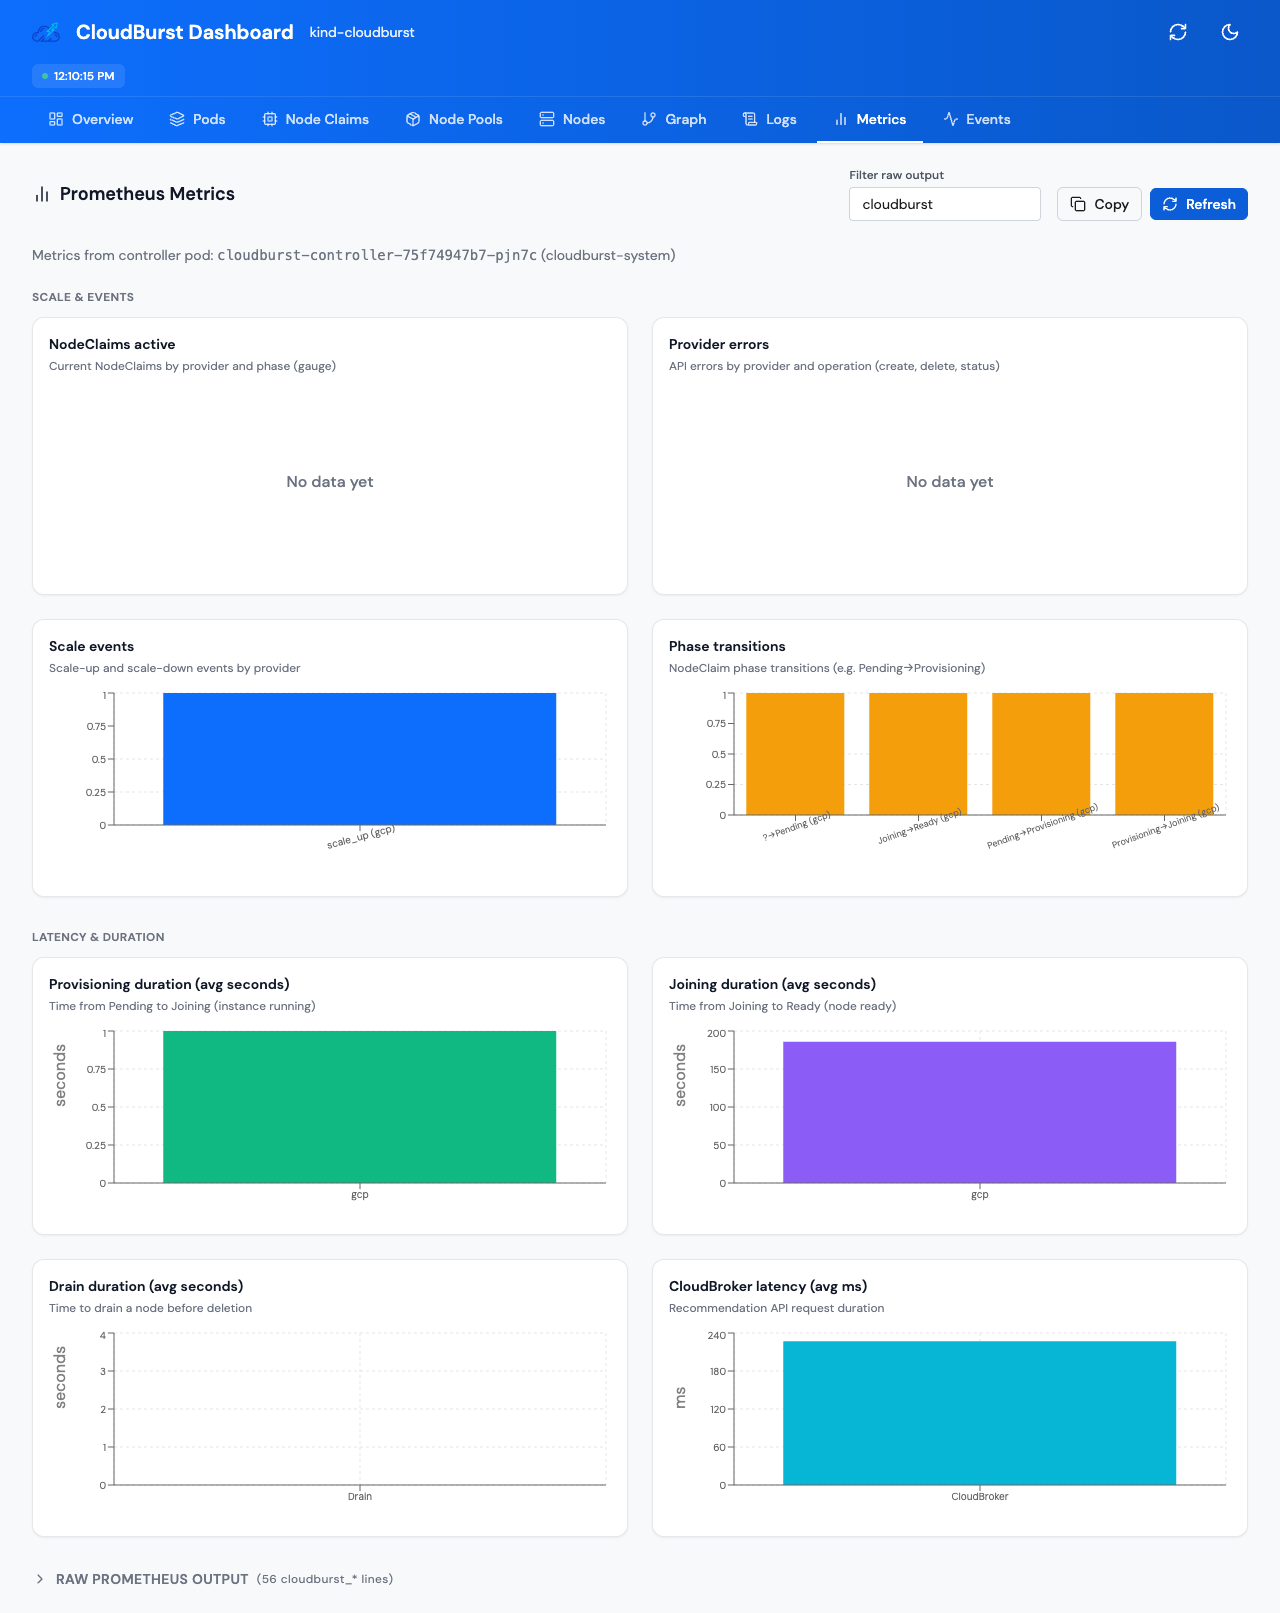
Metrics
Prometheus metrics exposed by the autoscaler for monitoring and alerting.
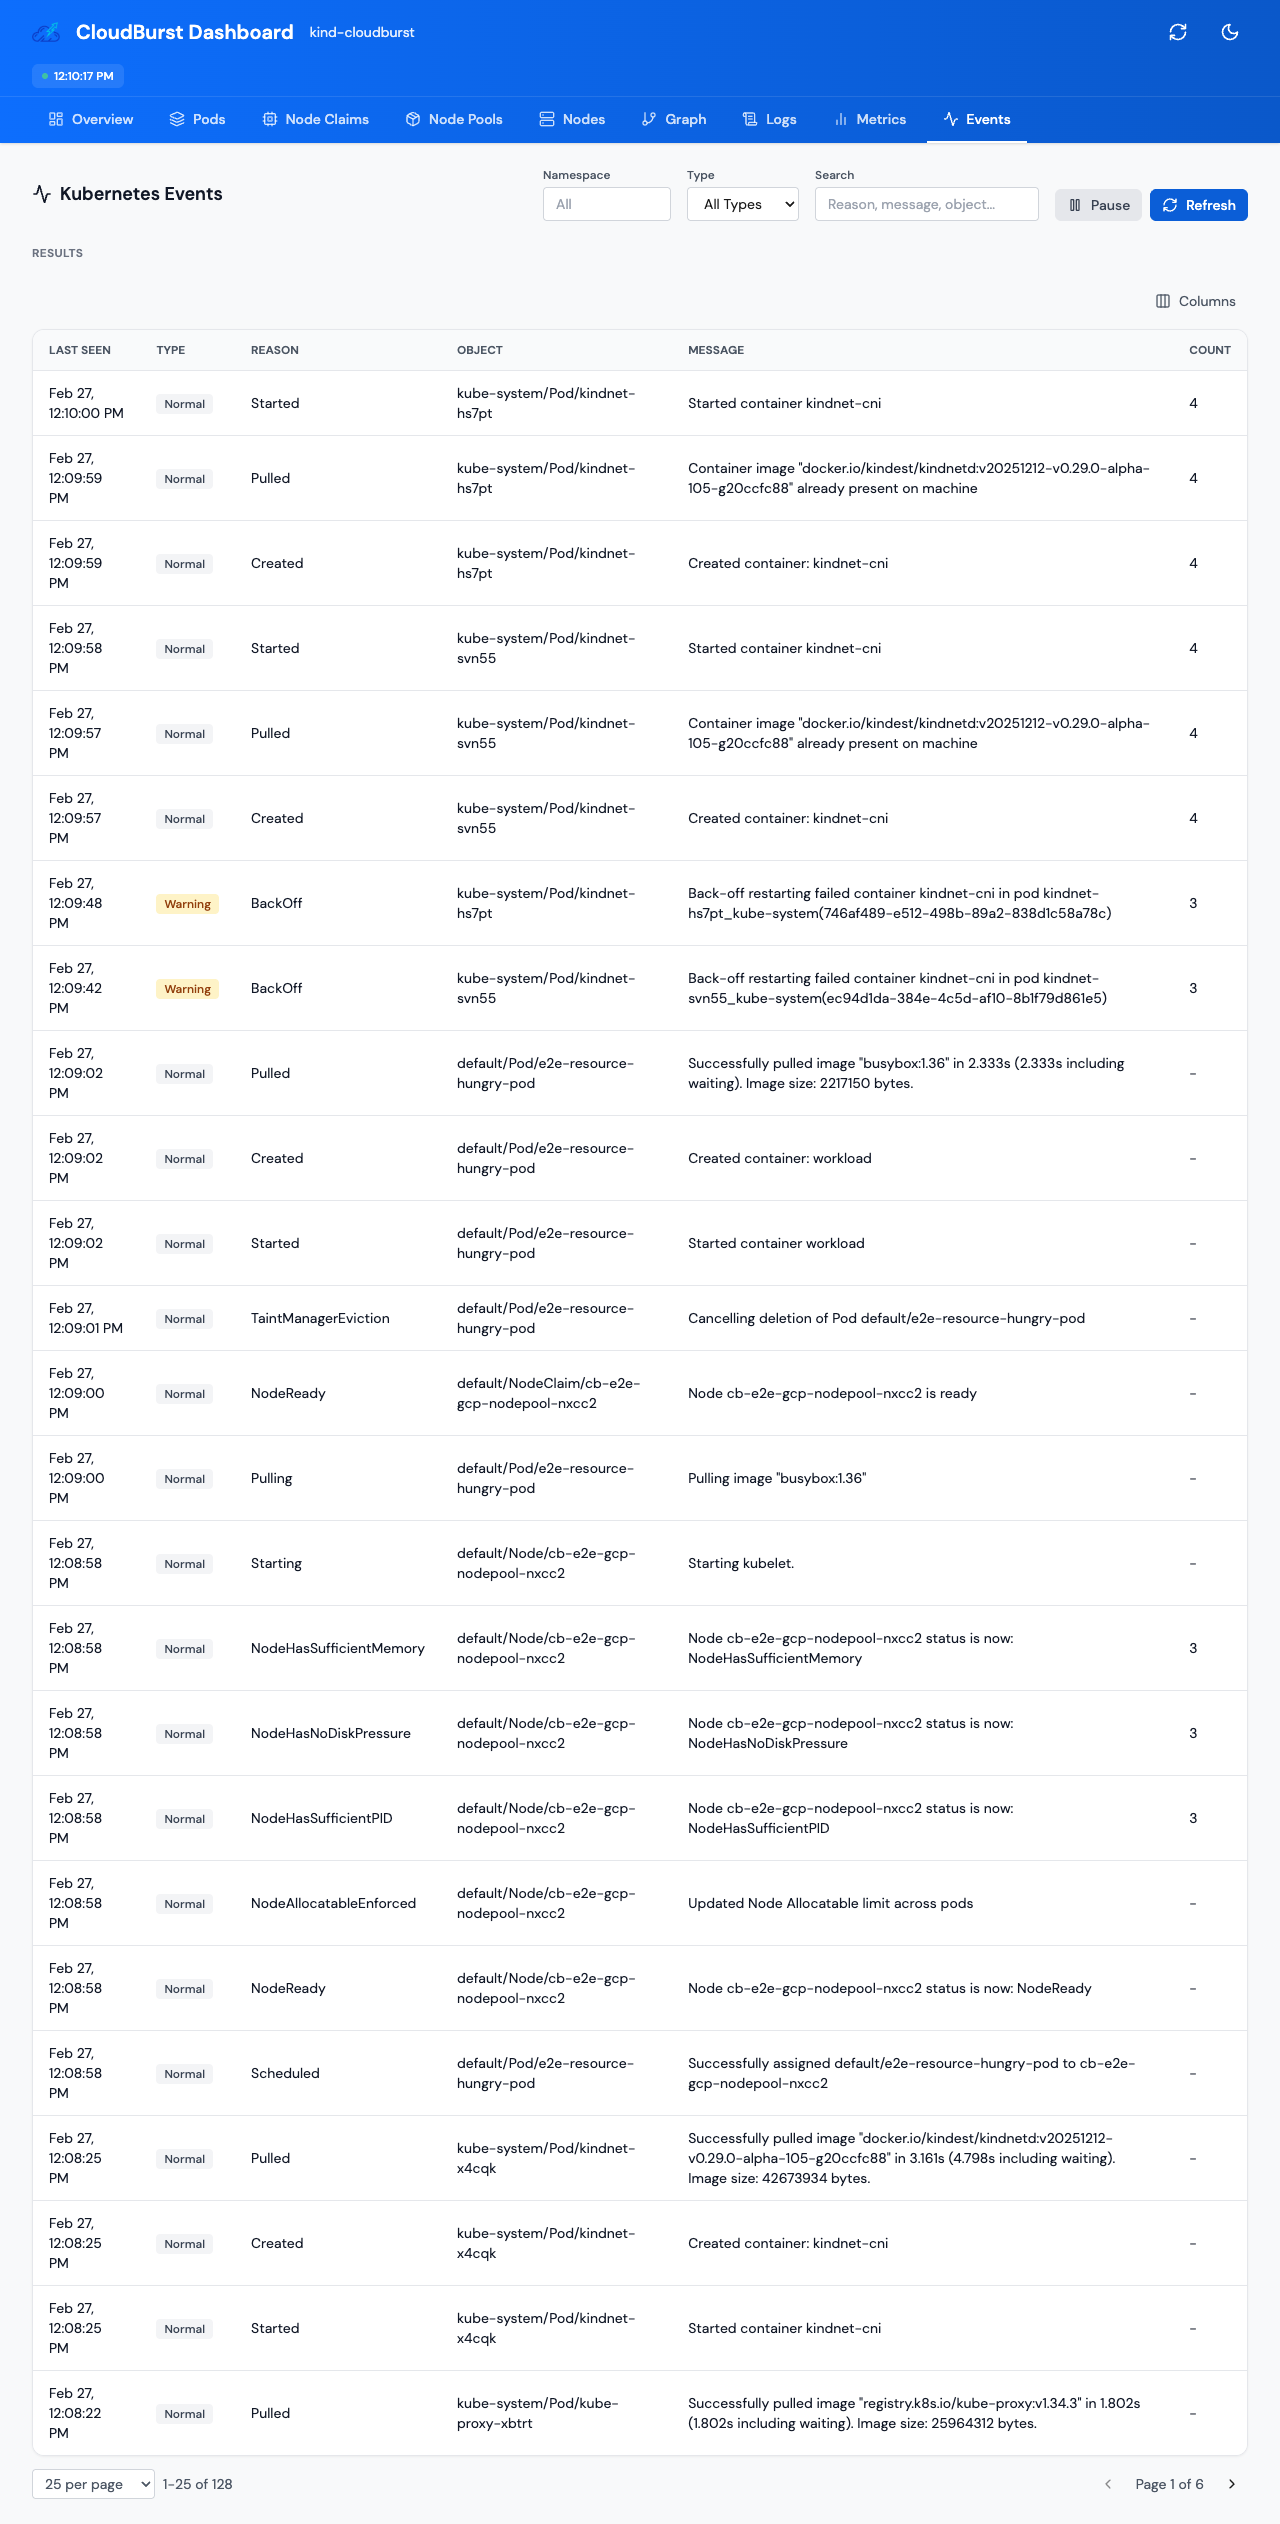
Events
Kubernetes events from the cluster for audit and troubleshooting.
Explore further